ibaInSpectra Bundle
For reliable real-time monitoring of vibrations, offline analysis tools for optimization and validation are indispensable. The iba system offers you coordinated tools for vibration monitoring and analysis combined with process data.

Frequency Band Analysis
FFT-Analysis, individual Frequencybands, Envelopes, Order Analysis, …

Auto Adapting Vibration Monitoring
Automated Learning of „good“ Conditions, Monitoring for Changes, Complete Frequency Spectrum, …

Orbit Analysis
Monitoring and Analyzing Shaft Movement and Vibration, Orbit Plot, Runup Analysis, Indicator Calculation based on DIN ISO 7919
Real Time Vibration Monitoring

Offline Vibration Analysis

ibaInSpectra Expert Module
Online Monitoring of Vibrations
The ibaInSpectra expert module monitors and analyzes vibrations in the frequency spectrum, which was generated using an FFT analysis. It can be used for a wide range of applications thanks to the high level of flexibility and versatility of the module.
Expert Module at a Glance

- Comprehensive configuration options
- Calculation profiles for multiple usage
- Customized visualization
- Waterfall display, single spectrum or contour plot
- Calculation of combined characteristic values
- Display of frequency bands and characteristic values
- Alarming in case of exceeded limit values
- Correlation of vibration and process data
- Order and envelope spectrum
Product Features
Versatile Module for individual Vibration Analysis
In the expert module, the frequency bands to be monitored can be freely defined, both statically as well as dynamically depending on other measurands. The following parameters are determined for each frequency band as a result of the analysis: Peak, RMS (square average), Peak frequency.
Order Analysis and Envelope Calculation
In the calculation profile of the ibaInSpectra Expert module, the user can select a speed signal for re-sampling the input signal depending on the rotation speed. This speed signal can be a pulse train, a pulse counter or an absolute speed value.
Alert and Alarm
When configuring the alert and alarm limit values, the ibaIn- Spectra Expert module automatically supplies analog or digital signals which are activated as soon as the limit values are exceeded. Via the output interfaces of ibaPDA, these signals can be made available to other systems for alerting or interventions in the process control.
Parameters for Calculation Profiles
| Sensor type | Displacement, speed, acceleration |
| Spectrum type | Displacement, speed, acceleration |
| Speed type (optional) | Pulse train, pulse counter, absolute rotation speed |
| Order analysis | Number of samples per revolution |
| Number of samples | up to 524288 |
| Number of lines | up to 204800 (depending on the number of samples) |
| Overlap | 0 to 95% |
| Suppress DC | yes/no |
| Drift compensation | yes/no |
| Window type | Bartlett, Blackman, Blackman-Harris, Hamming, Hanning, Rectangular, Flattop |
| Normalization | yes/no |
| Method | Magnitude/Power |
| Averaging type for frequency ranges | Linear, exponential, peak hold |
Example View of the Software
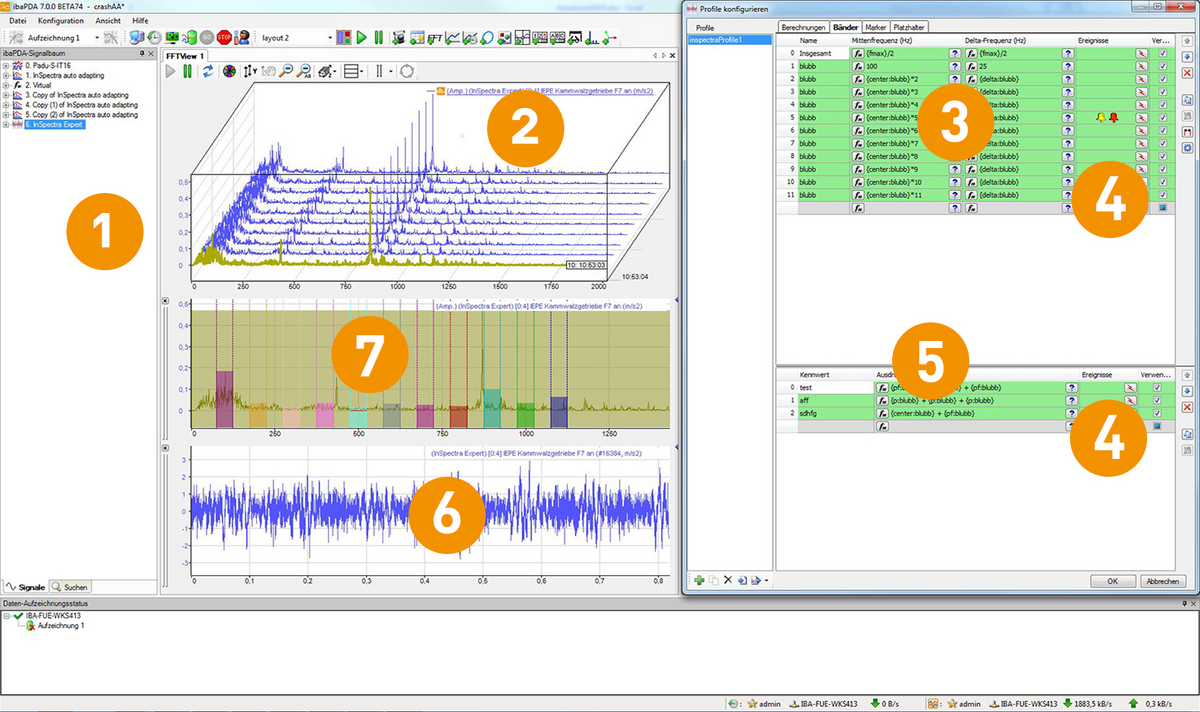
Configuration of Bands and characteristic Values
- Signal tree with calculated characteristic values and results of the frequency band analysis
- Real time visualization of the spectra as an individual spectrum, waterfall or contour view
- Configuration of the frequency bands to analyze
- Definition of alerts and alarms for frequency bands and characteristic values
- Configuration of the characteristic value calculation
- Raw data of the time signal of the current frequency analysis
- Visualization of the frequency bands with characteristic values and alarm thresholds
ibaInSpectra Auto-Adapting Module
Automatically learn Spectral Analysis
The auto-adapting module can be used to detect damage to machines, gearboxes and motors as well as qualityrelated changes in process vibrations already at a very early stage. The self-learning InSpectra module offers optimal protection for systems through automatic monitoring in real time using learned reference values.
Auto-Adapting Module at a Glance

- Self-learning InSpectra module for spectral analysis
- Reference spectra for various process conditions
- Analysis across the entire spectrum
- Automatic learning of reference values
- Individual definition of warning and alarm limits
- Online visualization in real time
- Early detection of changes and damage
Product Features
Detecting Damage at an early Stage
The auto-adapting module is able to use a series of spectra to learn what the ideal spectrum should look like. The so-called reference spectrum can be learned for various process states, which, for example, relate to different speeds, materials or load areas, etc.
Learning and Monitoring
Instead of having to manually configure a frequency analysis for certain ranges, all ranges of the spectrum are considered in the auto-adapting module. In the process, the spectrum can be individually divided into any number of ranges.
Convincing characteristic Values
The auto-adapting module calculates meaningful characteristic values for every state.
Learning and Monitoring Phase

Example View of the Software

Example of Monitoring with the ibaInSpectra Auto-Adapting Module
- Signal tree with calculated characteristic values and trends of the spectra difference
- Real time visualization of the spectra as an individual spectrum, waterfall or contour view
- Time gradient of difference to the learned reference spectra as an absolute and relative value
- Management and adjustment of the learned reference spectra for the different process conditions
- Visualization of the current spectrum (blue) and the reference spectra of the warning and alarm threshold (yellow and red) in the FFT view
ibaInSpectra Orbit Module
Monitoring the Shaft Motion
The ibaInSpectra Orbit module can be used to monitor the shaft motion relative to bearing housing and therefore allows a reliable monitoring and evaluation of the machine condition. For a stable calculation of the parameters, even at different speeds, the input signals are sampled relative to speed.
Orbit Module at a Glance

- Calculation of characteristic values for validation and monitoring
- Display of one or several shaft motions (orbit)
- Display of the shaft center motion (centerline)
- Speed-dependent resampling
- Visualization of acceleration levels
- Calculation profiles for multiple usage
- Customized visualization
- Display of the phase reference
- Averaging over several rotations (linear or peak hold)
Product Features
Calculation of speed-dependent characteristic Values
This ensures not only reliable results for all conditions but also allows an averaging of the orbit over several revolutions.
Better Insight thanks to a flexible Visualization
The orbit view offers various possibilities to adjust the visualization of the shaft motion individually. So the shaft motion can be visualized including phase reference. In addition, the movement history of the shaft center can be displayed over a time period.
Offline detailed Analysis with Playback Function
For a detailed offline analysis the recorded data can be opened together with the calculation profiles in ibaAnalyzer-InSpectra. Shaft motions can be analyzed subsequently and can be compared with other process data to recognize correlations. Additionally, the behavior can be reproduced at certain points of time, using the playback function.
Characteristic Values of the Orbit Module
| Orbit counter | Displacement, speed, acceleration |
| X/Y | Current shaft position in the coordinate system |
| Centerline X/Y | Center position of the shaft center per calculation in the coordinate system |
| Peak to Peak max | Peak to peak maximum value (S(p-p)max), maximum distance between two points in the orbit |
| Peak to peak max angle | Angle at which the S(p-p)max occurs |
| Peak to peak max shaft angle | Rotation angle of the shaft to which S(p-p) max occurs relatively to the key phasor |
| Eccentricity | Eccentricity of the shaft |
| Distance to clearance | Minimum distance of the shaft to the clearance circle |
Example View of the Software

Orbit Appearance in the PDA Client
- Visualization of the sensor positions and the clearance circle
- Time gradient of the calculated characteristic values, such as: peak to peak maximum value, eccentricity and distance to the clearance
- Real time visualization of the shaft motion, blankbright visualization of the key phasor, gradient of the centerline and speed levels for run-up and run-down
- Signal tree with calculated characteristic values and results of the orbit analysis